Agent Health Dashboard
A new dashboard page has been added to provide administrators with a way to proactively identify issues with agents in their environment.
The dashboard includes three sections:
- Agent Connection Overview – includes the total number of workstations currently connected and the number of workstations connected in the past 30 days.
- Connected Workstations – a trend line of the number of connected workstations along with the average number of connected workstations for the period to establish a relative baseline.
- Connections by Extension Type – trend line tiles for each extension type. Options include a line chart of the last 30 days of the number of users, sessions or activities.
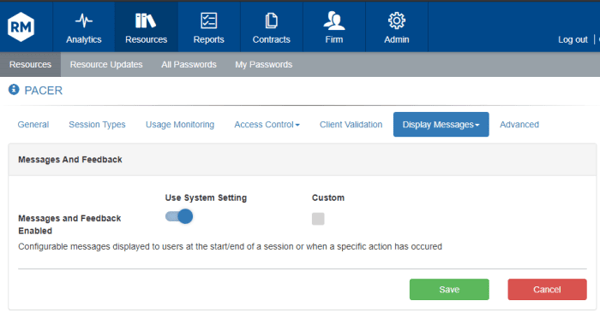
Messages and Feedback Configuration Interface
The configuration options for displaying message or feedback prompts to end users are now available in the ResearchMonitor web interface. Previously, these settings were only accessible through the admin client.

For details of all the enhancements and changes in this release please review the release notes which can be accessed via the support portal. If you have any questions please don’t hesitate to contact ResearchMonitor support or your relationship manager for details.


